Exploratory Data Analysis (EDA) is a crucial step in data science workflows. It involves summarizing datasets, identifying patterns, detecting anomalies, and gaining insights to prepare data for modeling. This post covers essential and advanced EDA techniques using Python, complete with code snippets and explanations.
Why Perform EDA?
- Understand Data Structure: Identify data types, shape, and size.
- Spot Anomalies: Find missing values, outliers, or inconsistent entries.
- Generate Hypotheses: Understand trends and relationships.
- Validate Assumptions: Ensure your dataset aligns with business objectives.
Sample Dataset
We’ll use a sample dataset for demonstration:
import pandas as pd

data = {
    'Name': ['Alice', 'Bob', 'Charlie', 'David', 'Eva', 'Alice', 'Frank'],
    'Age': [25, 30, 35, 40, None, 25, 50],
    'City': ['New York', 'Los Angeles', 'New York', 'Chicago', 'Chicago', None, 'Seattle'],
    'Salary': [70000, 80000, 120000, 90000, 60000, 70000, 110000],
    'Experience': [2, 5, 8, 10, 1, 2, 15]
}

df = pd.DataFrame(data)
The DataFrame:
| Name | Age | City | Salary | Experience |
|---|---|---|---|---|
| Alice | 25.0 | New York | 70000 | 2 |
| Bob | 30.0 | Los Angeles | 80000 | 5 |
| Charlie | 35.0 | New York | 120000 | 8 |
| David | 40.0 | Chicago | 90000 | 10 |
| Eva | NaN | Chicago | 60000 | 1 |
| Alice | 25.0 | None | 70000 | 2 |
| Frank | 50.0 | Seattle | 110000 | 15 |
1. Basic Dataset Overview
Dataset Structure
df.info()
This shows the number of non-null entries, data types, and memory usage:
<class 'pandas.core.frame.DataFrame'>
RangeIndex: 7 entries, 0 to 6
Data columns (total 5 columns):
 #   Column       Non-Null Count  Dtype
---  ------       --------------  -----
 0   Name         7 non-null      object
 1   Age          6 non-null      float64
 2   City         6 non-null      object
 3   Salary       7 non-null      int64
 4   Experience   7 non-null      int64
dtypes: float64(1), int64(2), object(2)
memory usage: 408.0+ bytes
Dataset Size
df.shape
Output:
(7, 5)
The dataset has 7 rows and 5 columns.
2. Missing Values
Check for Missing Values
df.isnull().sum()
Output:
Name          0
Age           1
City          1
Salary        0
Experience    0
dtype: int64
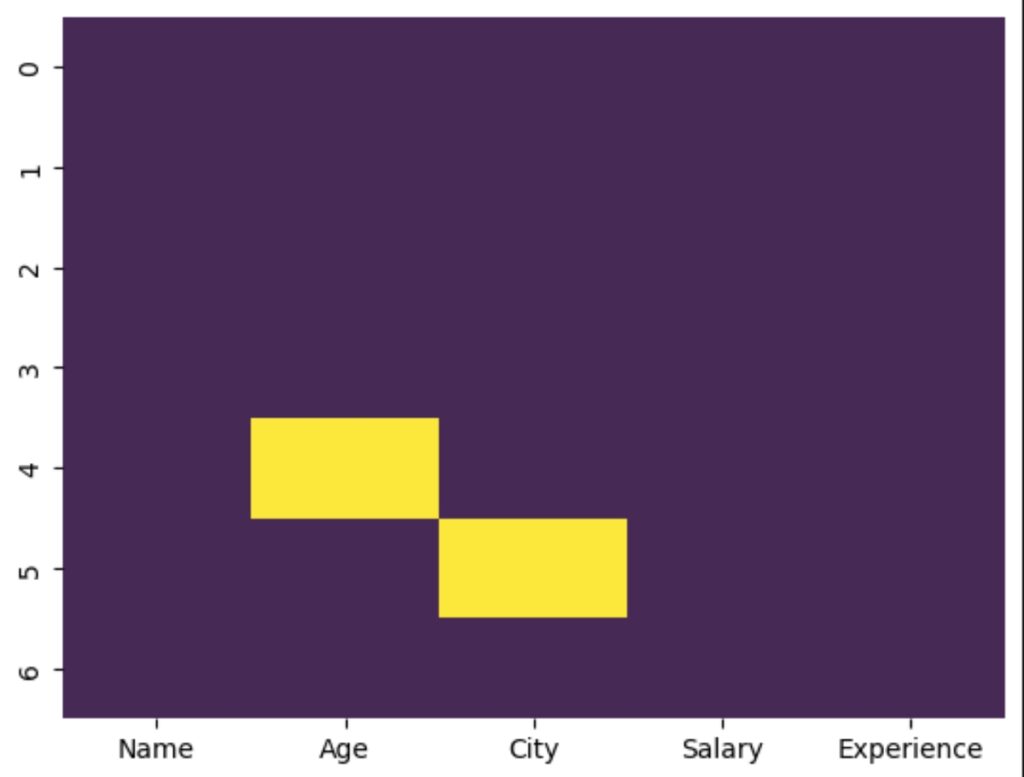
Visualize Missing Data
import seaborn as sns
import matplotlib.pyplot as plt

sns.heatmap(df.isnull(), cbar=False, cmap="viridis")
plt.show()
This creates a heatmap, where missing values are highlighted.
3. Summarizing Data
Descriptive Statistics
df.describe()
| Age | Salary | Experience | |
|---|---|---|---|
| count | 6.0 | 7.0 | 7.0 |
| mean | 34.2 | 85714.29 | 6.14 |
| std | 9.35 | 20445.78 | 5.21 |
| min | 25.0 | 60000.0 | 1.0 |
| 25% | 27.5 | 70000.0 | 2.0 |
| 50% | 35.0 | 80000.0 | 5.0 |
| 75% | 40.0 | 110000.0 | 10.0 |
| max | 50.0 | 120000.0 | 15.0 |
4. Handling Duplicates
Detect and Count Duplicates
df.duplicated().sum()
Output:
1
Remove Duplicates
df.drop_duplicates(inplace=True)
5. Correlation Analysis
Correlation Matrix
df.select_dtypes(include=['number']).corr()
| Age | Salary | Experience | |
|---|---|---|---|
| Age | 1.0 | 0.87 | 0.88 |
| Salary | 0.87 | 1.0 | 0.84 |
| Experience | 0.88 | 0.84 | 1.0 |
Heatmap for Correlation
sns.heatmap(df.corr(), annot=True, cmap="coolwarm")
plt.show()
6. Outlier Detection
Using IQR Method
q1 = df['Salary'].quantile(0.25)
q3 = df['Salary'].quantile(0.75)
iqr = q3 - q1
outliers = df[(df['Salary'] < (q1 - 1.5 * iqr)) | (df['Salary'] > (q3 + 1.5 * iqr))]
Output:
Rows with outliers in the Salary column.
7. Categorical Analysis
Value Counts
df['City'].value_counts()
Output:
New York    2
Chicago     2
Los Angeles 1
Seattle     1
Name: City, dtype: int64
8. Feature Engineering
Normalize a Column
df['normalized_salary'] = (df['Salary'] - df['Salary'].min()) / (df['Salary'].max() - df['Salary'].min())
Create a New Column Using Lambda
df['Salary_Category'] = df['Salary'].apply(lambda x: 'High' if x > 85000 else 'Low')
9. Skewness Check
df.skew()
Output:
Age           0.460
Salary        0.522
Experience    0.827
dtype: float64
Conclusion
EDA is an essential process to explore data and uncover patterns, relationships, and anomalies. By combining these techniques, you’ll be better prepared to preprocess data and build robust models.
Let us know how you perform EDA and if I missed any must-have techniques!
Please visit https://subhadip.ca/blog/ for more topics..
A good article on this: Read here